
Fleet cost tracking
Fleet Cost Tracking Software: Know What Every Vehicle Costs
How much is your fleet costing you, and how much is each vehicle costing you? Axpense records every repair, spare part, insurance payment and other expense against the vehicle it belongs to, so the answer is a report, not a week of collecting receipts.
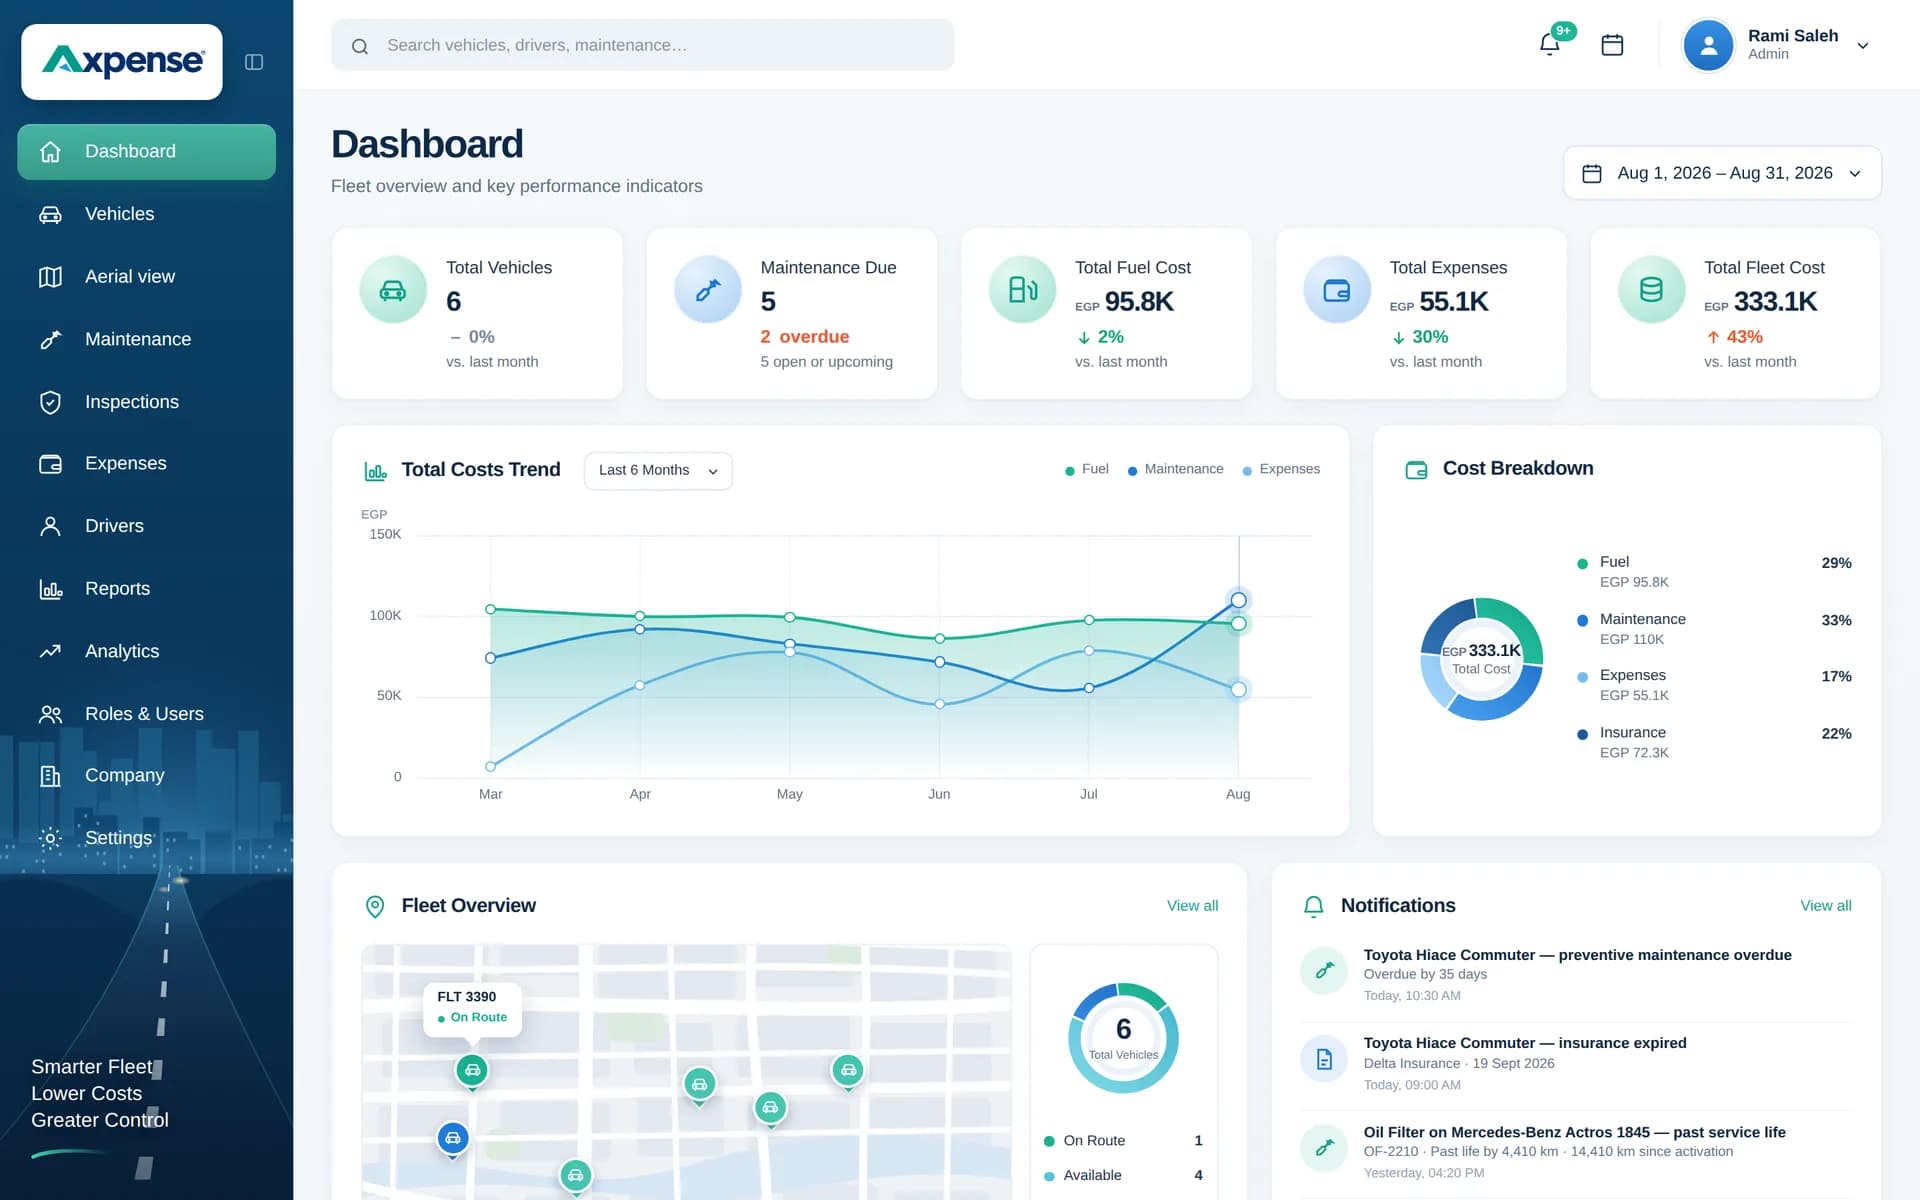
Why fleet costs are hard to see
In most companies, the money a vehicle consumes is paid from several places. The workshop invoice goes through purchasing, the insurance renewal goes through finance, the registration fee is paid by an administrator and small costs like tyre repairs or parking are paid in cash by the driver. Each payment is recorded somewhere, but almost never against the vehicle.
The result is a fleet total that finance can report and a per-vehicle picture that nobody can. You know the fleet cost a lot last year. You don’t know that two of your forty vans account for a quarter of the repair bill, or that the pickup you planned to keep another three years already costs more per kilometre than a new one would.
Fleet cost tracking software fixes the attachment problem. Every cost is entered once, with a category and a vehicle, and from that point the totals, the comparisons and the cost per kilometre come from the same records.
The operating costs Axpense brings together
Each expense is recorded against a vehicle and a category, so you can look at the fleet by type of cost or by vehicle.
Maintenance and repairs
Periodic services, breakdown repairs and workshop labour, linked to the vehicle’s service history.
Spare parts
Parts tracked from purchase to installation, so the cost lands on the vehicle the part went into.
Insurance
Policy premiums recorded per vehicle, so an expensive-to-insure vehicle stands out in the totals.
Registration and licensing
Registration and licence fees kept with the vehicle rather than in a general admin budget.
Other expenses
Tyres, washing, tolls, parking, fines and anything else, each under a category you can report on.
Fuel
Fuel purchases recorded as an expense on the vehicle, so the largest running cost is part of every total.
Vehicle cost tracking: the cost of each vehicle
Vehicle cost tracking means keeping a running total for every vehicle rather than for the fleet as a whole. In Axpense, each vehicle record shows the expenses logged against it, grouped by category and period, next to its odometer reading, service history and assigned driver.
That per-vehicle view answers questions a fleet total never can:
- Which vehicles cost the most to run this year? Sort the fleet by total cost and the outliers are obvious.
- Is a vehicle getting more expensive as it ages? Compare its costs this year with last year, category by category.
- Is the cost driven by the vehicle or by how it is used? Because drivers are assigned to vehicles, you can see who was driving when the repair bills climbed.
Over time the per-vehicle record becomes the vehicle’s lifecycle cost: everything spent on it from the day it joined the fleet. Add the purchase price and the book value from depreciation, and you have the basis for per-vehicle total cost of ownership. The detail of how expenses are entered and categorised is on the fleet expense management page.
How to calculate cost per km
Cost per kilometre is the fairest way to compare vehicles that drive very different distances. A truck that costs twice as much as a van may still be cheaper per kilometre if it drives three times as far.
Cost per km
Cost per km = total operating costs for the period ÷ km driven in the period
Worked examples in EGP and SAR
Example 1: a delivery van in Cairo, one month (EGP). The van drove 5,000 km during the month.
| Cost category | Amount (EGP) |
|---|---|
| Maintenance and repairs | 3,200 |
| Spare parts | 2,800 |
| Insurance (monthly share) | 1,500 |
| Registration (monthly share) | 400 |
| Other (tolls, washing, parking) | 600 |
| Total operating costs | 8,500 |
Cost per km = 8,500 ÷ 5,000 = 1.70 EGP per km.
Example 2: a pickup in Riyadh, one quarter (SAR). The pickup drove 12,000 km in three months.
| Cost category | Amount (SAR) |
|---|---|
| Maintenance and repairs | 1,450 |
| Spare parts | 900 |
| Insurance (quarterly share) | 750 |
| Registration and other | 300 |
| Total operating costs | 3,400 |
Cost per km = 3,400 ÷ 12,000 = 0.28 SAR per km.
Use the same period for costs and kilometres, and spread annual costs such as insurance across the months they cover. Include fuel too: fuel records on the vehicle profile feed straight into the total. Axpense keeps both halves of the formula on the vehicle record: the costs logged against it and its odometer readings.
Total cost of ownership (TCO) for a fleet vehicle
Cost per km tells you what a vehicle costs to run. Total cost of ownership tells you what it cost to own, from purchase to sale, and is the number to use when comparing models or deciding how long to keep vehicles.
Total cost of ownership
TCO = purchase price + total operating costs over ownership + financing costs − resale value
Worked example: a light truck kept for five years
| Item | Amount (EGP) |
|---|---|
| Purchase price | 1,200,000 |
| Operating costs over 5 years (110,000 a year) | 550,000 |
| Financing costs (loan interest) | 150,000 |
| Expected resale value | − 450,000 |
| Total cost of ownership | 1,450,000 |
If the truck drives 200,000 km over the five years, its lifetime cost is 1,450,000 ÷ 200,000 = 7.25 EGP per km, including the loss in value. That is the figure to compare against a different model, or against keeping the truck for a sixth year.
Operating costs come from the expenses logged in Axpense over the vehicle’s life; the purchase price and book value come from the vehicle record and its depreciation schedule.
Depreciation and the lifecycle cost of a vehicle
Depreciation is the part of vehicle cost you never see on an invoice. A vehicle bought for 1,200,000 EGP and expected to sell for 450,000 EGP after five years loses value at roughly (1,200,000 − 450,000) ÷ 5 = 150,000 EGP a year on a straight-line basis. That is often larger than a year of repairs.
Axpense calculates book value over time for each vehicle, so finance and operations look at the same number. Put next to the running costs, it shows the full lifecycle cost: what the vehicle has cost so far and what it is still worth. How depreciation schedules are set up is covered on the vehicle depreciation and lifecycle page.
Planning vehicle replacement with real numbers
Replacement decisions are easier to make, and to defend to management, when they rest on the vehicle’s own history. Signals worth watching in the cost reports:
Repair and parts costs rising year on year while kilometres stay flat.
Cost per km well above similar vehicles doing similar work.
Book value falling towards the point where a major repair would cost more than the vehicle is worth.
The same components failing repeatedly, visible in the service and parts history.
Frequent unplanned repairs that take the vehicle off the road between scheduled services.
Keeping maintenance costs predictable
Unplanned repairs are the most expensive way to maintain a vehicle: the part costs more when it is urgent, the vehicle is off the road longer and a small fault often damages something else on the way. Servicing by kilometres driven keeps more of your maintenance spend planned.
Axpense schedules preventive maintenance by kilometre and records every service against the vehicle, so the cost reports show the split between routine servicing and repairs. How the maintenance side works is covered on the fleet maintenance software page.
Cost reports your finance team can use
The reports turn the records your team already keeps into answers:
- Costs by vehicle for any period, to find the vehicles that cost the most.
- Costs by category, to see whether repairs, parts or insurance are driving the total.
- Fleet overview, with total spend next to maintenance status, so cost and condition are read together.
Managers can move from the fleet total to a single vehicle’s expense list in a click, which makes month-end questions quick to answer. More on the dashboards and report types is on the fleet reporting page, and cost tracking works alongside the rest of our fleet management software.
Try the numbers before you set anything up
Want a quick answer for one vehicle? Enter its costs, kilometres, purchase price and resale value in our free fleet cost per km and TCO calculator. It uses the same formulas as this page.
When you are ready to track costs for the whole fleet, Axpense is priced per vehicle per month with every feature included: 350 EGP, 38 SAR or $10 per vehicle for 5–10 vehicles, and less per vehicle as the fleet grows. You can start free, and onboarding is free. See the pricing page for details.
Frequently asked questions
Can Axpense show the cost of each vehicle?
Yes. Every expense is recorded against a vehicle and a category, so each vehicle record shows its own running total, and the reports rank vehicles by cost for any period.
How do I calculate cost per kilometre?
Divide the total operating costs for a period by the kilometres driven in the same period. For example, 8,500 EGP of costs over 5,000 km is 1.70 EGP per km. Our cost per km guide walks through it step by step.
What is total cost of ownership (TCO) for a fleet vehicle?
TCO is everything a vehicle costs from purchase to sale: purchase price plus operating costs over ownership plus financing costs, minus the resale value. It is the right number for comparing models or deciding when to replace. See fleet total cost of ownership.
What is the difference between cost per km and TCO?
Cost per km measures running costs over a period and is best for comparing vehicles week to week or month to month. TCO covers the whole ownership period, including purchase, financing and resale, and is best for buy, keep or replace decisions.
Which costs should we record for each vehicle?
At minimum: maintenance and repairs, spare parts, insurance, registration and licensing, and a catch-all for other costs such as tyres, tolls and washing. A short, fixed list of categories keeps reports comparable over time.
How does depreciation fit into fleet cost tracking?
Depreciation is the loss in a vehicle’s value over time. Axpense keeps each vehicle’s book value, which you need for TCO and for knowing when a major repair is no longer worth doing.
We have years of costs in spreadsheets. Do we need to import them all?
No. Most teams start recording from the current month and add past costs for the vehicles where history matters, such as older vehicles being considered for replacement. For monthly running-cost totals, see how to calculate fleet costs.
Can we record fuel costs in Axpense?
Yes. Fuel purchases can be recorded as an expense against the vehicle, so they are included in the vehicle’s totals and in cost per km.
Related guides
How to Calculate Vehicle Cost per km: Formula and Worked Examples
The formula for vehicle cost per km, which costs to include, worked examples in EGP and SAR, and the mistakes that make the number misleading.
Read articleFleet Total Cost of Ownership: How to Calculate TCO and Compare Vehicles
How to calculate fleet total cost of ownership, compare two vehicles on TCO, and use the numbers to decide when a vehicle should be replaced.
Read articleHow to Calculate Fleet Costs and Build a Fleet Budget
How to calculate fleet costs for the whole fleet: fixed vs variable costs, cost categories, a 20-vehicle monthly budget in EGP and a variance review routine.
Read articleSee Axpense with your own fleet
Book a short demo. We’ll set up a few of your vehicles and show you how it works day to day.