
Reports and dashboards
Fleet Reporting Software: Maintenance and Cost Dashboards Without Spreadsheets
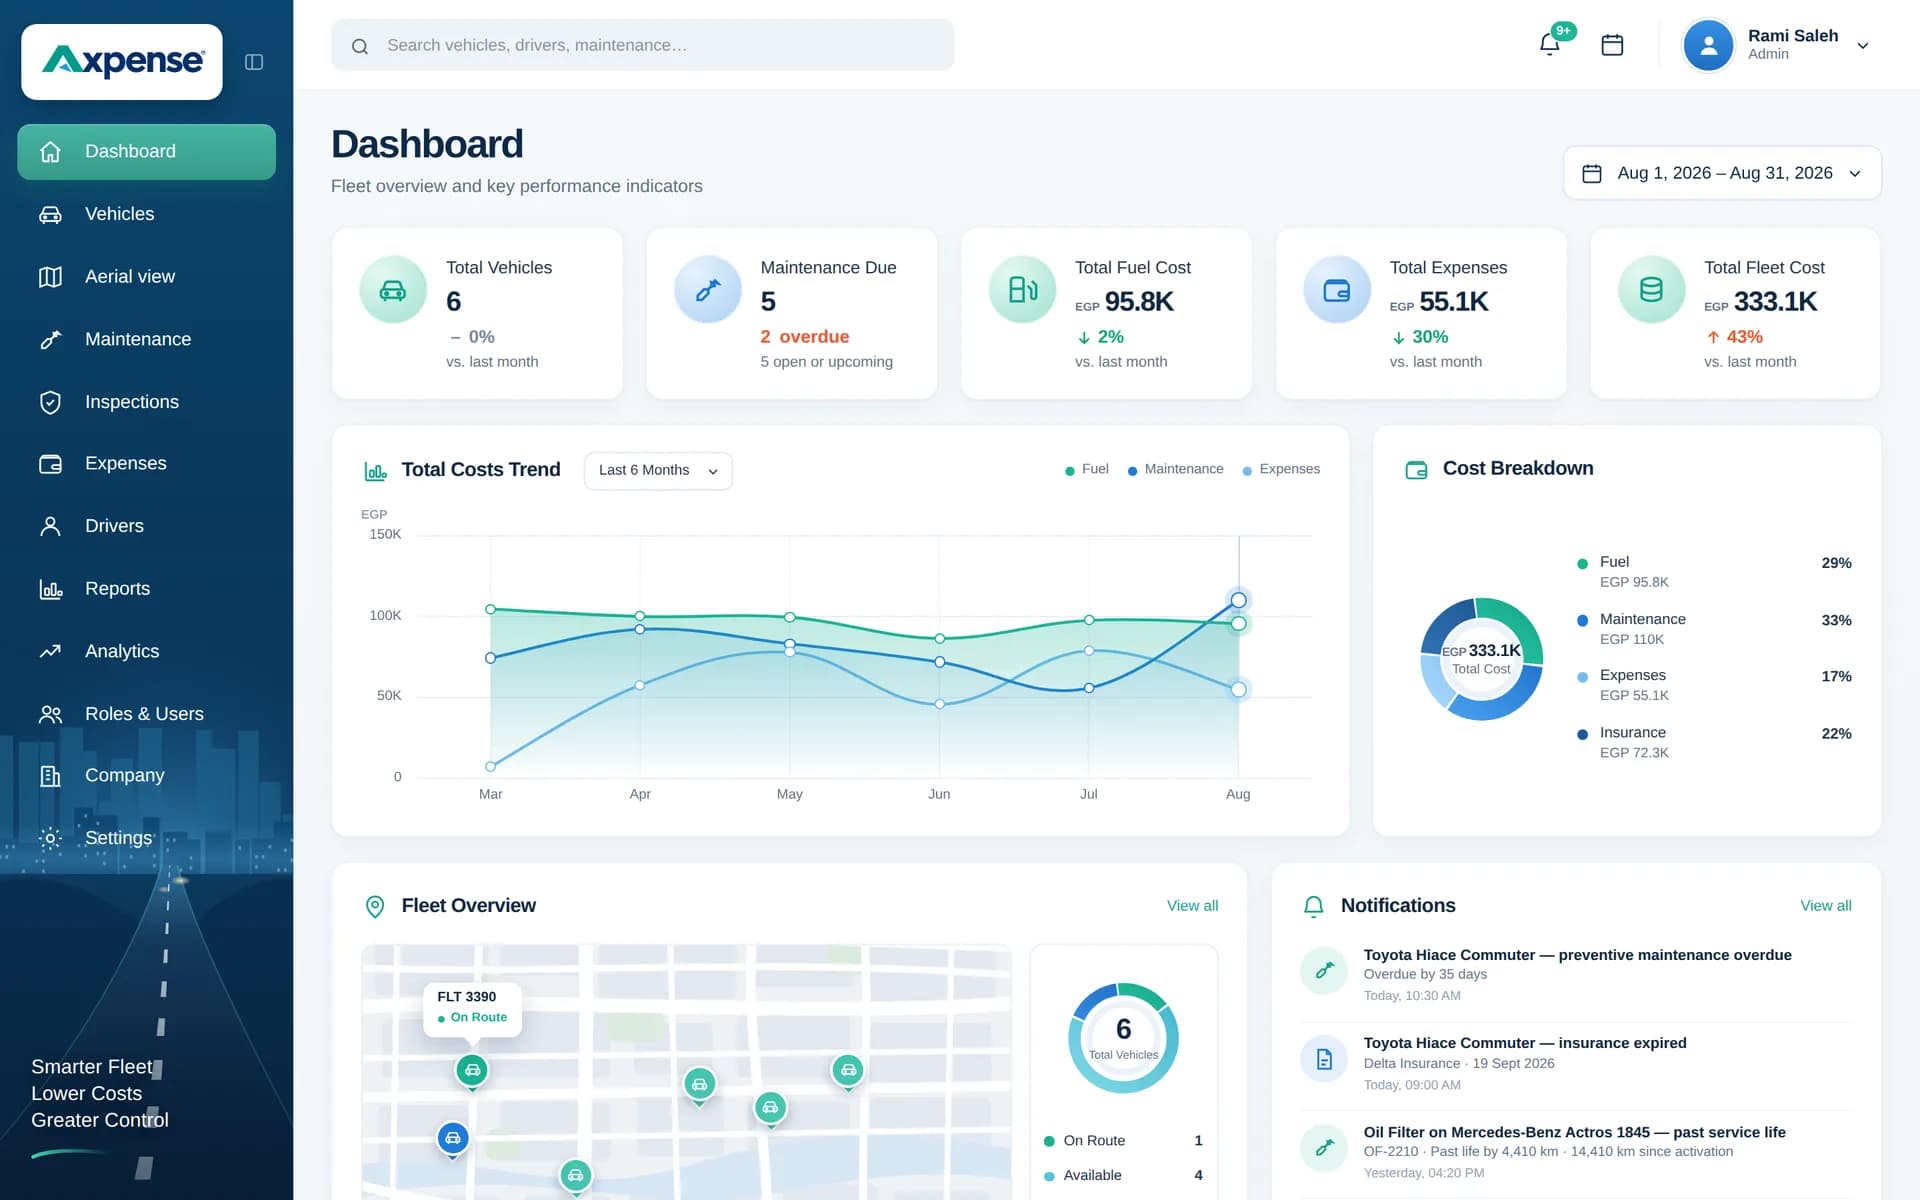
Axpense turns the records your team already keeps, services, inspections and expenses, into dashboards that show what is due, what is overdue and where the money goes. Nobody has to build the report at month-end, because it is already there.
What is fleet reporting software?
Fleet reporting software turns day-to-day fleet records into dashboards and reports that show the state of the fleet and what it costs. It answers the questions management asks every month without someone spending a day copying numbers between spreadsheets.
The quality of a fleet report depends on the records behind it. In Axpense, reports are built from the same vehicle records the team uses every day, so they are only as old as the last service or expense someone entered.
The reports and dashboards in Axpense
Each view answers one question a fleet manager is regularly asked.
Maintenance status
Services due soon and overdue, calculated from each vehicle’s kilometres and its service intervals. The first place to look every morning.
Cost by vehicle
What each vehicle has cost, from the expenses recorded against it. Shows at once which vehicles are the most expensive to run.
Cost by category
Spend split into repairs, spare parts, insurance, registration and other, so you can see where the money actually goes.
Cost trend
How fleet spend moves month to month, so a steady rise in repair costs is visible before the year-end review.
Fleet overview
The whole fleet at a glance: vehicles, their status and the headline numbers management asks for first.
One dashboard for maintenance and costs
The dashboard combines maintenance status and cost figures, updated from the records your team enters.
How the numbers get there
There is no separate reporting data to prepare. Every figure comes from something recorded in daily work:
- A vehicle’s odometer reading and its service intervals in kilometres drive the due and overdue list. See preventive maintenance for how intervals are set.
- Every expense recorded on a vehicle, in its category, feeds cost by vehicle, cost by category and the trend. See expense management.
- The vehicle registry provides the fleet overview.
Because the data is shared, the maintenance view and the cost view always refer to the same vehicles, which is rarely true when each lives in a separate spreadsheet.
A 20-minute monthly fleet review
A simple routine many fleet managers follow with the dashboard open.
- 1
Clear the overdue list
Start with services overdue by kilometre. Each one is a vehicle running past its interval and should be booked this week.
- 2
Look ahead at services due
Check which vehicles will reach their interval soon and plan workshop time so several don’t land on the same day.
- 3
Check this month’s spend by category
Compare with last month. A jump in repairs is worth a question; a jump in spare parts may simply be a round of tyres.
- 4
Find the top-cost vehicles
Look at cost by vehicle and note the three most expensive. If the same vehicles appear month after month, review them for replacement.
- 5
Share the headline numbers
Give management the fleet total, the overdue count and the top-cost vehicles, with the reason behind each.
KPIs worth tracking from your dashboard
These are practical measures you can read from Axpense or work out from its figures. Pick a few and track them every month:
| KPI | Why it matters |
|---|---|
| Services overdue | Every overdue service is a risk of breakdown and extra wear. The target is zero. |
| Monthly cost per vehicle | Fleet spend ÷ number of vehicles. Useful for budgeting and comparing branches. |
| Repairs as a share of total cost | A rising share usually means an ageing fleet or maintenance being skipped. |
| Top-cost vehicles | The same names every month point to replacement candidates. |
| Cost per km | Total cost ÷ km driven. Use our fleet cost per km calculator. |
Keep the list short. Three numbers reviewed every month do more than twenty that nobody reads.
Who uses fleet reports
- Fleet and operations managers use the maintenance status daily and the cost views monthly.
- Finance teams use cost by category and the trend for month-end and budgeting.
- General managers and owners use the fleet overview to understand the fleet in a few minutes.
- Workshop supervisors use the due list to plan their week.
Reporting is one part of running a fleet well. For the full picture of vehicles, drivers, maintenance and costs working together, see our fleet management software page.
Frequently asked questions
What reports does Axpense include?
Maintenance status (services due and overdue by kilometre), cost by vehicle, cost by category, the cost trend over time and a fleet overview, all on the dashboard.
Do I need to prepare data for the reports?
No. Reports are built from the vehicles, services and expenses your team records in daily work, so they stay current without a separate reporting step.
How does Axpense know which services are overdue?
Each vehicle has service intervals in kilometres and an odometer reading. When the distance since the last service passes the interval, the service shows as overdue.
Which KPIs should a fleet manager track?
Start with services overdue, monthly cost per vehicle, repairs as a share of total cost and the top-cost vehicles. Add cost per km once your odometer readings are reliable.
Can finance use these reports for month-end?
Yes. Cost by category and the monthly trend give finance a vehicle-level view of spend that complements the accounting system.
Related Axpense pages
Related guides
Fleet Management Excel Template vs Software: When to Switch
An honest comparison of a fleet management Excel template vs software: what a good sheet includes, where it breaks, and the signs it is time to switch.
Read articleHow to Calculate Fleet Costs and Build a Fleet Budget
How to calculate fleet costs for the whole fleet: fixed vs variable costs, cost categories, a 20-vehicle monthly budget in EGP and a variance review routine.
Read articleHow to Calculate Vehicle Cost per km: Formula and Worked Examples
The formula for vehicle cost per km, which costs to include, worked examples in EGP and SAR, and the mistakes that make the number misleading.
Read articleSee Axpense with your own fleet
Book a short demo. We’ll set up a few of your vehicles and show you how it works day to day.